
I've refactored my stats aggregator three times now. First try was code-based transformations - 100'000 rows took longer than client browser could wait. Next I ported all the aggregations to PostgreSQL - it was much faster, but 500'000 row aggregation still took like 10 seconds. I know I can't escape a cache table, but if the basic query is so slow, then the cache query will also run into trouble soon.
In a database with now 1.5 million rows this command takes 1.5 seconds. And this is what I thought was optimized.
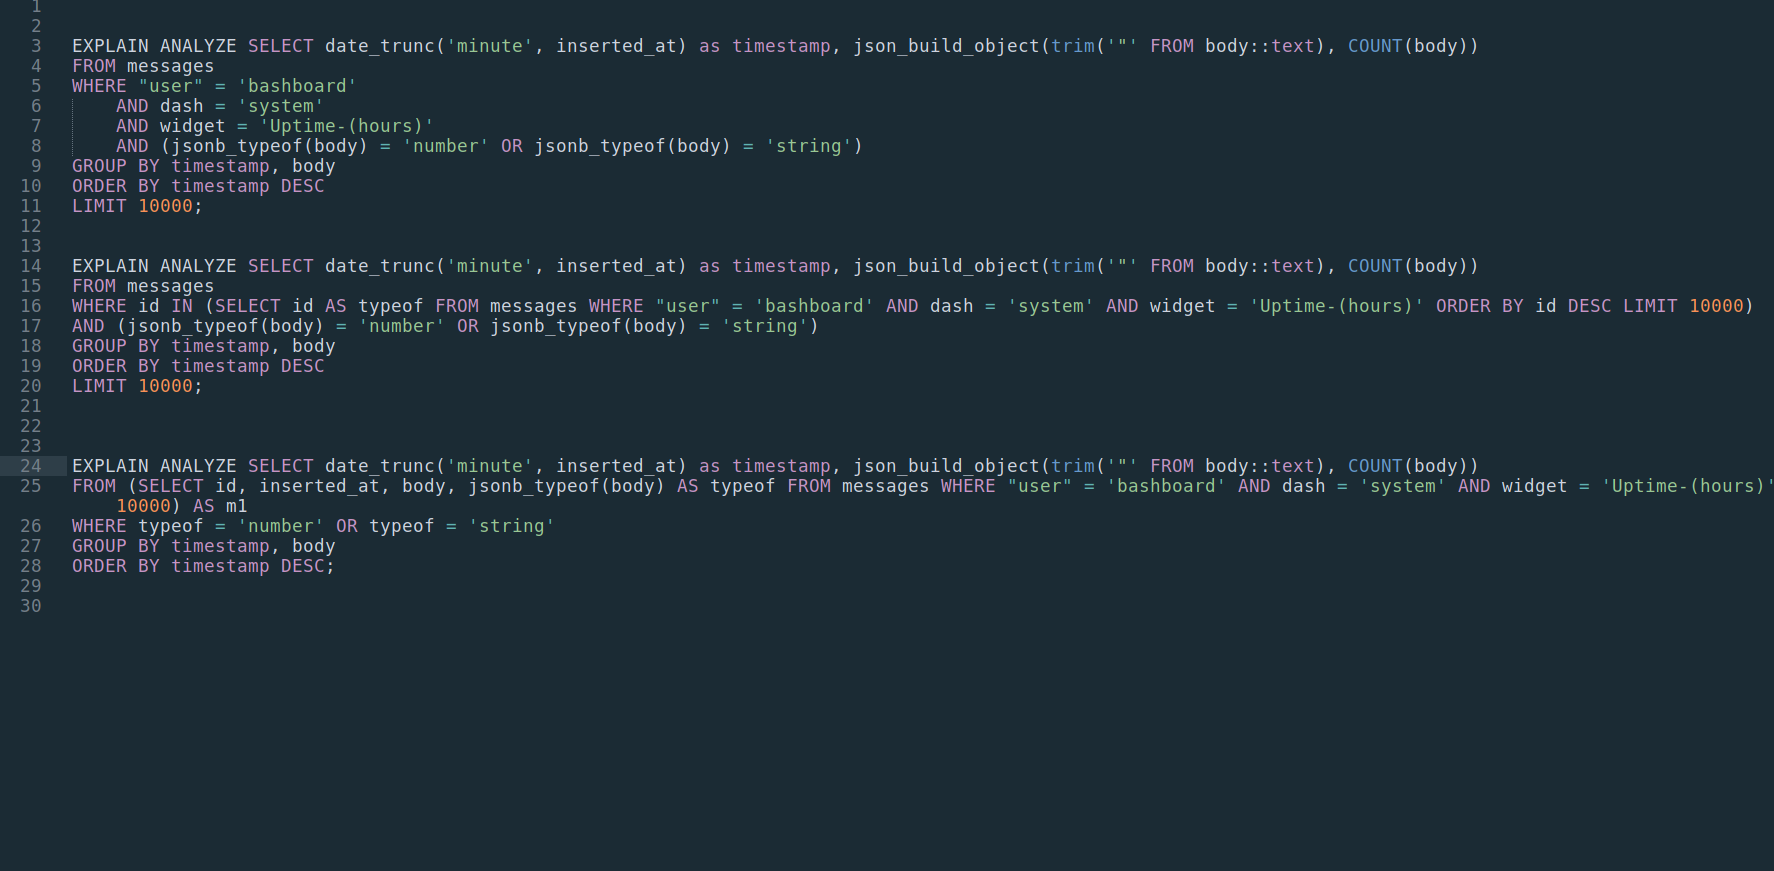
EXPLAIN ANALYZE SELECT date_trunc('minute', inserted_at) as timestamp, json_build_object(trim('"' FROM body::text), COUNT(body))
FROM messages
WHERE "user" = 'bashboard'
    AND dash = 'system'
    AND widget = 'Uptime-(hours)'
    AND (jsonb_typeof(body) = 'number' OR jsonb_typeof(body) = 'string')
GROUP BY timestamp, body
ORDER BY timestamp DESC
LIMIT 10000;
Explain result (from explain.depesz.com):
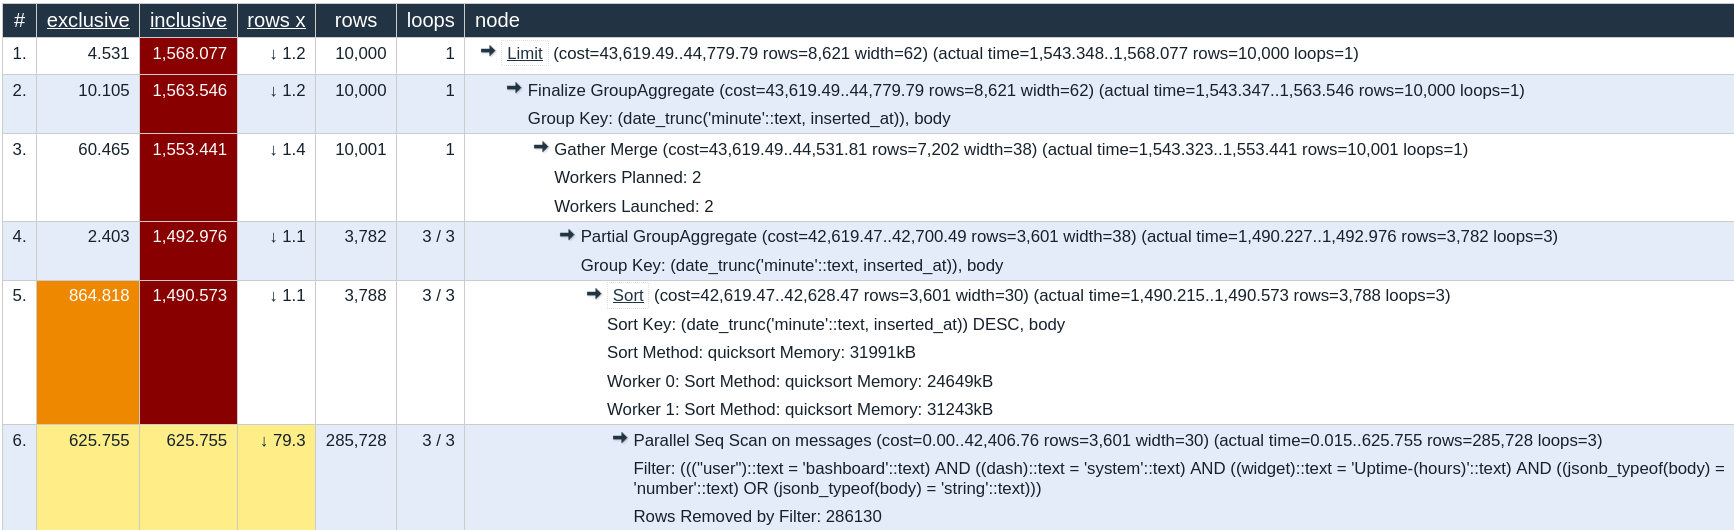
So the initial scan takes 600ms and then the sorting an extra 800ms.
What to avoid
Why postgre gets slow is a deep rabbit hole and I'm a noob. But here's what I've found out.
GROUP BY is processor intensive Makes sense since grouping and comparing is a raw calculation. Solution: Make a subquery with WHERE so GROUP BY has less data to transform. If GROUP and WHERE are in the same query, it takes a lot more time to compute than using a subquery.
ORDER BY is also very processor intensive. Why? Because it needs to traverse your whole table to know what to order. Solution: order on an indexed column, like id. If you successfully use an index then the data is already ordered (assuming [you're using btree]() which is default). If needed, create an extra index. Ideally you would index all of the columns you need for the query so you can create an index-only scan (confirm with EXPLAIN and looking for something like Index Scan Backward using messages_pkey).
Functions like date_trunc() and jsonb_typeof() take extra time. You should probably try them out yourself, because in my case removing date_trunc() removed 10% from the query time, but json_build_obj() didn't remove any. Solution: SELECT the value in a subquery. In my case I already had a subquery because of GROUP BY, and by using SELECT jsonb_typeof(body) AS typeof I could then use WHERE typeof = 'number' outside of the subquery (final command at the end).
The amount of data is of course one of the main culpripts. ORDER BY for example get's more complicated the more data you have by n*n. Solution: LIMIT the data in a subquery. If you don't have a subquery the LIMIT only has an effect on the results, not how many rows are fed into the aggregation in the first place. This is why an index-only scan works - it doesn't have to finish traversing your whole table. Time saved.
All in all it's not one or the other aggregate function that slowed everything down - it was all of them together. So making a very specific subquery was what make the 1500ms query go to 40ms.
Fast SELECT with subquery
EXPLAIN ANALYZE
SELECT date_trunc('minute', inserted_at) as timestamp,
	json_build_object(trim('"' FROM body::text),
	COUNT(body))
FROM (
	SELECT id, inserted_at, body, jsonb_typeof(body) AS typeof
    FROM messages
    WHERE "user" = 'bashboard'
    	AND dash = 'system'
        AND widget = 'Uptime-(hours)'
    ORDER BY id DESC
    LIMIT 10000
) AS m1
WHERE typeof = 'number' OR typeof = 'string'
GROUP BY timestamp, body
ORDER BY timestamp DESC;
And the EXPLAIN:
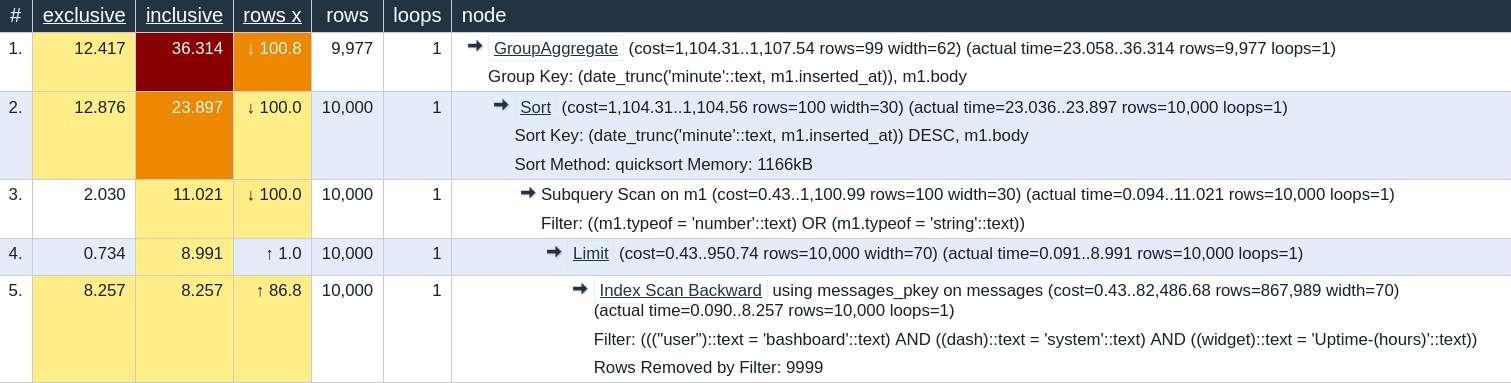
Basically the subquery first filters the data by using an index-only scan. SELECT already formats data for later so the conversions wouldn't have to be done multiple times.
In theory it should be possible to index an expression like CREATE INDEX reverse_json_index4 ON public.messages USING btree (jsonb_typeof(body)); but after hours of getting it to work the query actually got slower... Not sure why.
I tried beefing up my AWS PostgreSQL server
So if the 1vCPU and 1Gb RAM did the query in around 2 sec (free tier), then a 2vCPU and 2Gb RAM machine did it in 1.7sec ($20 a month). Then I tried a top notch $200 a month server (4vCPU and 8Gb RAM) and it went down to 0.4sec - which wasn't enough. Clearly it meant that I'm a terrible query writer and need to learn more, so I did :)
What to remember to keep aggregations fast
- Make a subquery to separate heavy operations from simpler ones.
- Subquery should be an index-only scan that filters results.
- Heavy lifting has to be done with minimal operatsions.
- Use EXPLAIN ANALYZE to figure out what's going on.